使用sysbench测试infocycle_fdw查询性能
测试机器: 原有的InfoCycle虚拟机
| 信息 | |
|---|---|
| 操作系统 | CentOS6.9 |
| 内存 | 8G |
| CPU | 2核4线程 |
| 硬盘 | 机械硬盘 |
| 网络 | 千兆 |
| PosgtreSQL版本 | 11beta3 |
| 测试数据量 | 576000行 |
sysbench使用的测试脚本:1
2
3
4
5
6
7
8
9
10
11
12
13
14
15
16
17
18
19
20
21
22#!/usr/bin/env sysbench
require("oltp_common")
function prepare_statements()
-- We do not use prepared statements here, but oltp_common.sh expects this
-- function to be defined
end
function event(thread_id)
local begin_query = "BEGIN"
local commit_query = "COMMIT"
math.randomseed(os.time())
local begin_pos = math.random(1,9)
local end_pos = math.random(begin_pos,10)
db_query(begin_query)
con:query(string.format("SELECT * FROM ecs2 WHERE station='%s' limit 100",begin_pos))
con:query(string.format("SELECT * FROM ecs2 WHERE station BETWEEN '%s' AND '%s' limit 100",begin_pos, end_pos))
con:query(string.format("SELECT * FROM ecs2 WHERE station BETWEEN '%s' AND '%s' ORDER BY archivetime desc limit 100",begin_pos, end_pos))
db_query(commit_query)
end
本次测试1-8个线程,每个线程重复测试3次。每次压测时间为120秒。
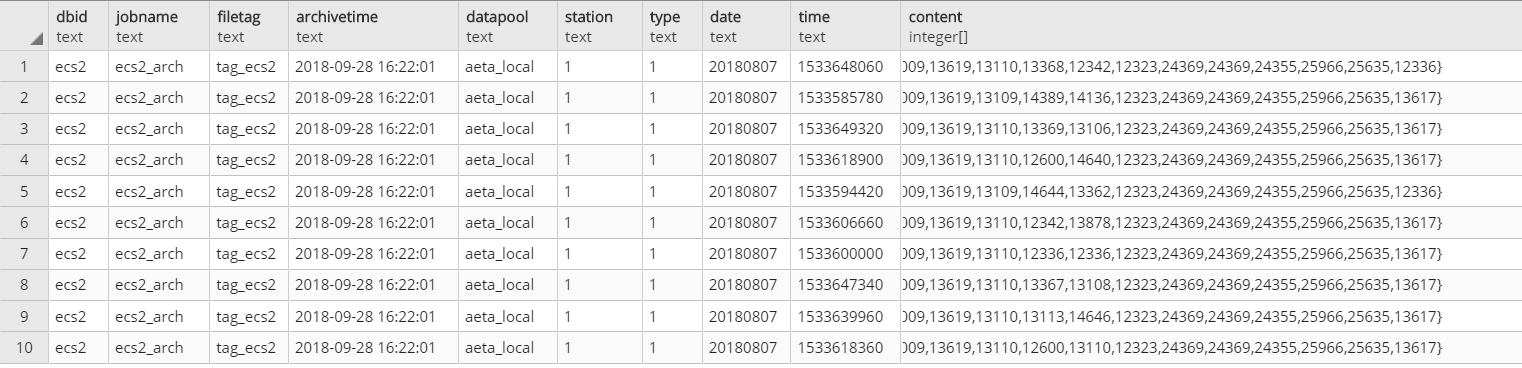
样本数据:
使用的测试脚本:1
2
3
4
5
6
7
8
9
10
11
12
13
14
for i in 1 2 3 4 5 6 7 8;
do
for j in 1 2 3;
do
echo "doing $i the $j times"
/appdb/sysbench/bin/sysbench --db-driver=pgsql --pgsql-host=192.168.10.82 --pgsql-port=5432 --pgsql-user=atlasdb --pgsql-password=123456 --pgsql-db=infocycle --time=120 --report-interval=5 --threads=$i /appdb/sysbench/share/sysbench/pgotlp.lua run >> /data/sysbench.log ;
echo "sleeping";
sleep 10;
done
done
将sysbench输出结果输出到csv:1
cat sysbench.log | egrep " cat|threads:|transactions|queries:|read:|write:|other:|total:|min:|avg:|max:|percentile:" | tr -d "\n" | sed 's/Number of threads: /\n/g' | sed 's/\[/\n/g' |sed 's/[A-Za-z\/]\{1,\}://g'| sed 's/ \.//g' | sed -e 's/read\/write//g' -e 's/approx\. 95//g' -e 's/per sec.)//g' -e 's/ms//g' -e 's/(//g' -e 's/^.*cat //g' |sed 's/ \{1,\}/,/g'
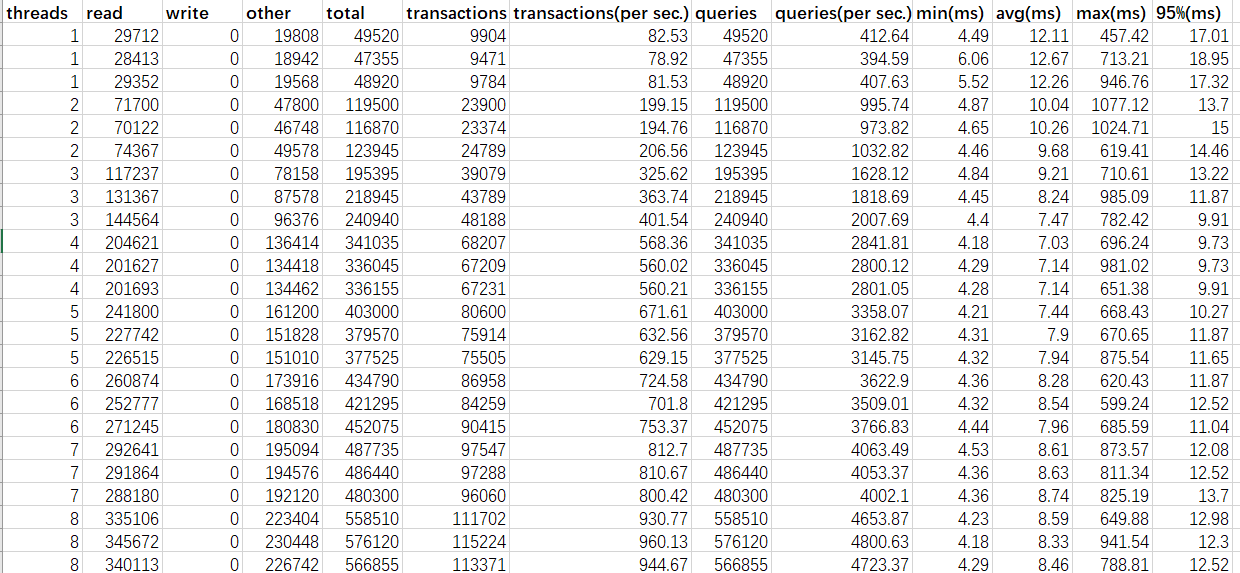
测试结果:
以上结果不可信
发现以上结果的QPS有点高,不太可信,所以重新验证一下,发现上面的测试场景中,后面2条的SQL执行要不就是没有返回,要不就是执行出错,并且把事务的开关QPS都算进里面了,导致sysbench测试结果有误。
重测
于是重新整理测试场景,重新测试,这次测试是1-8个线程,每个线程重复测试5次。每次压测时间为120秒。
场景1:查询某个station的某个type的某个时间的记录
1 | #!/usr/bin/env sysbench |
测试时服务器的情况:
1线程时: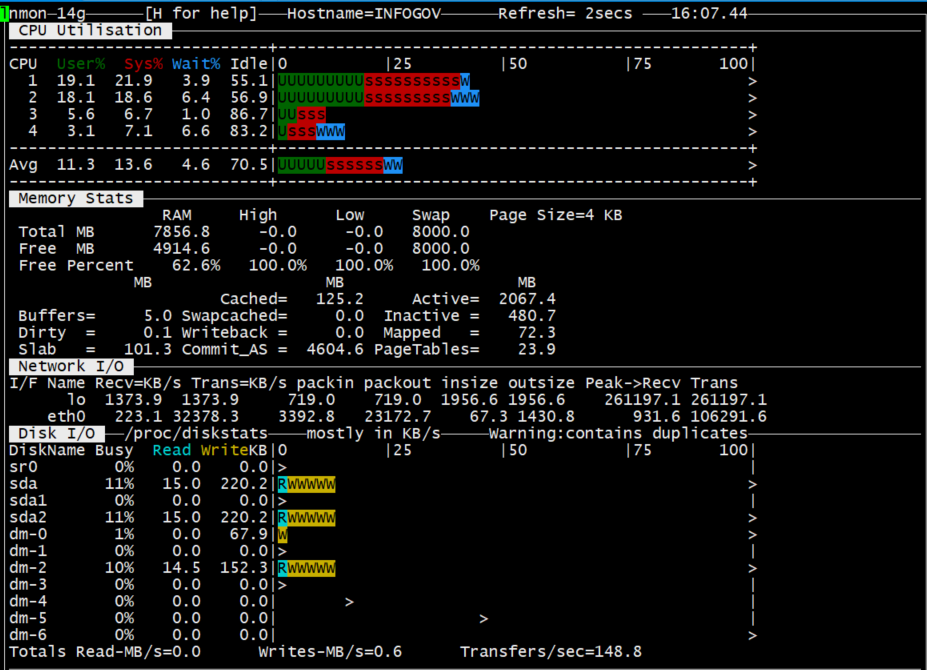
2线程时: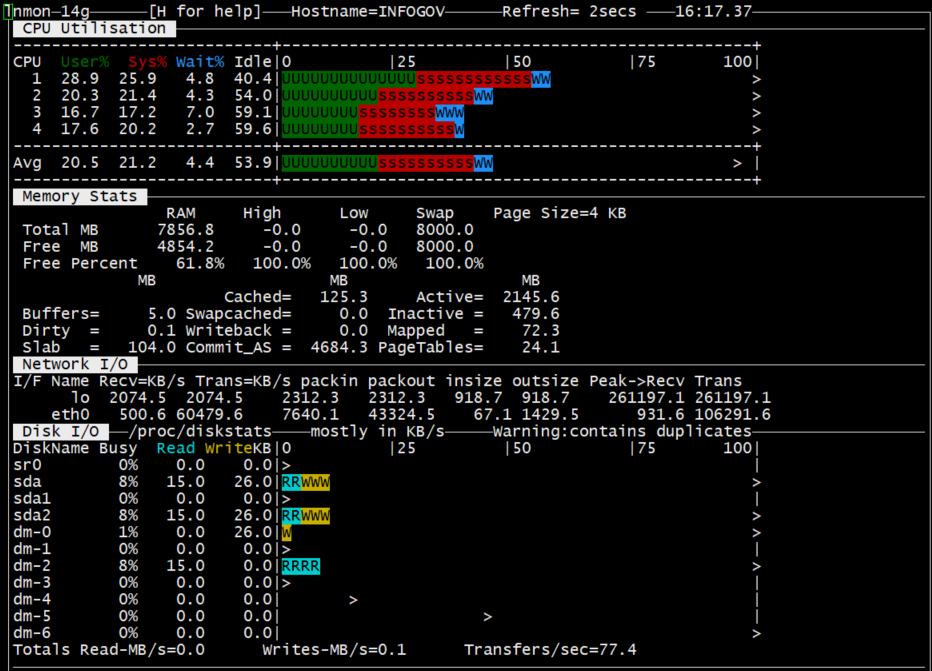
3线程时: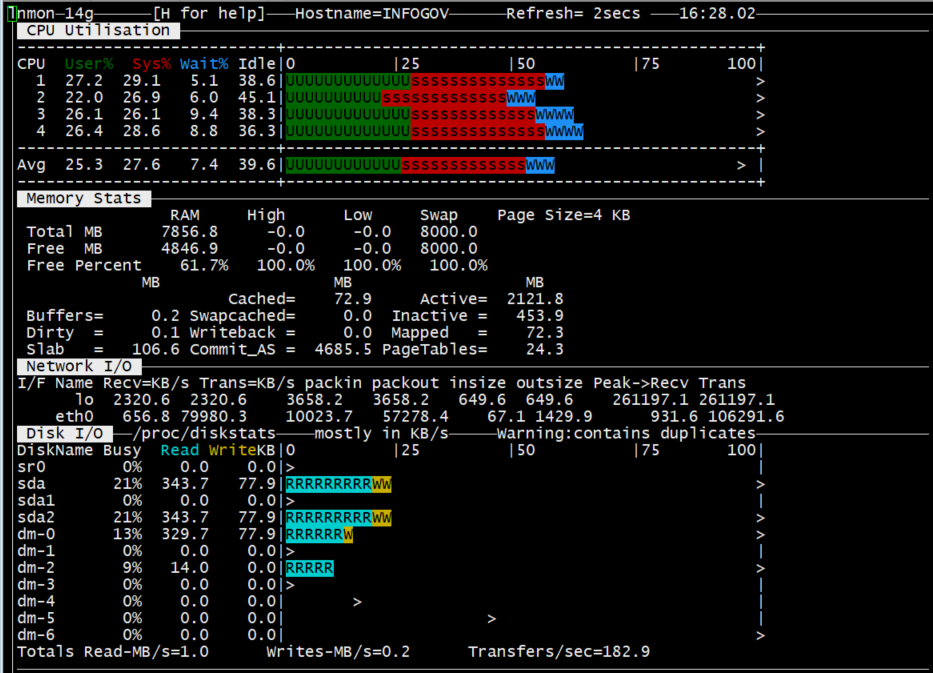
4线程时: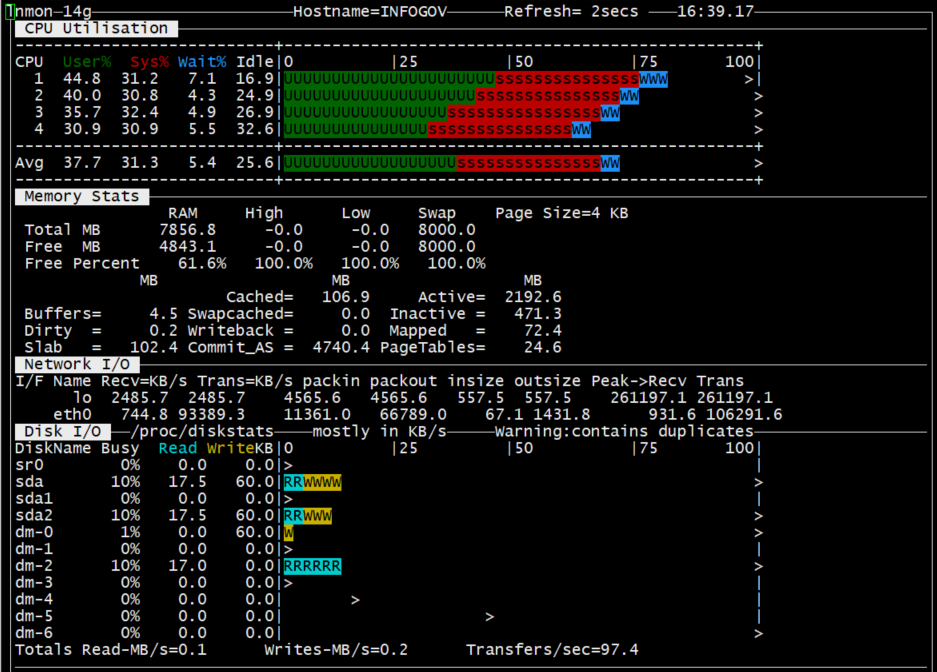
5线程时: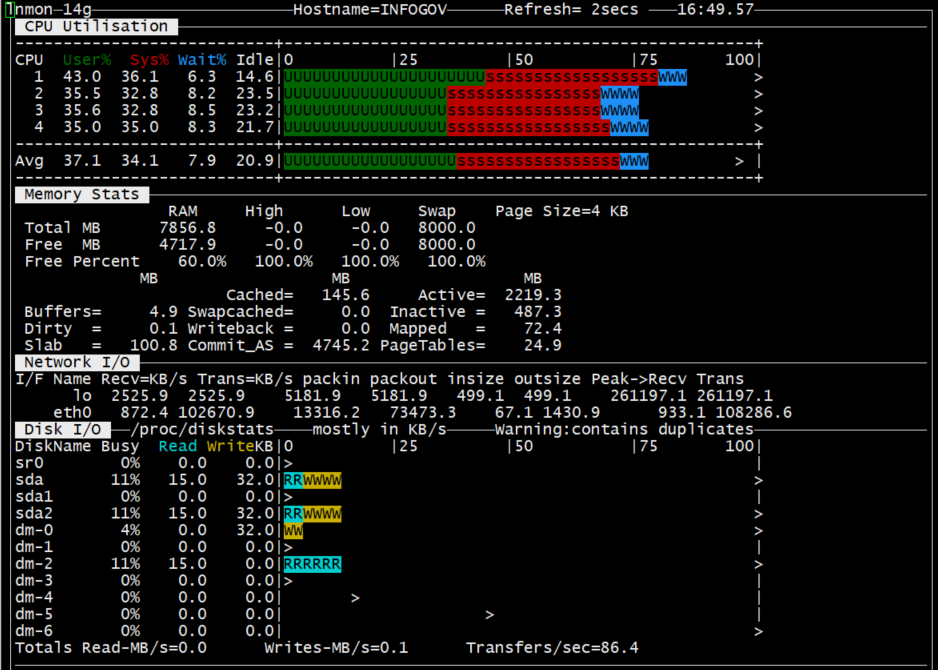
6线程时: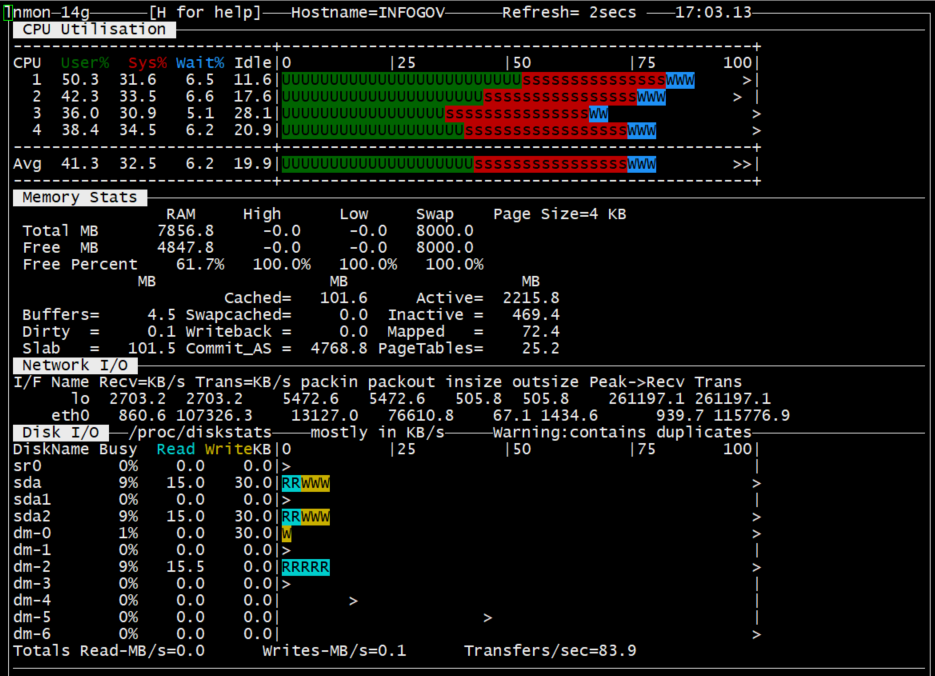
7线程时: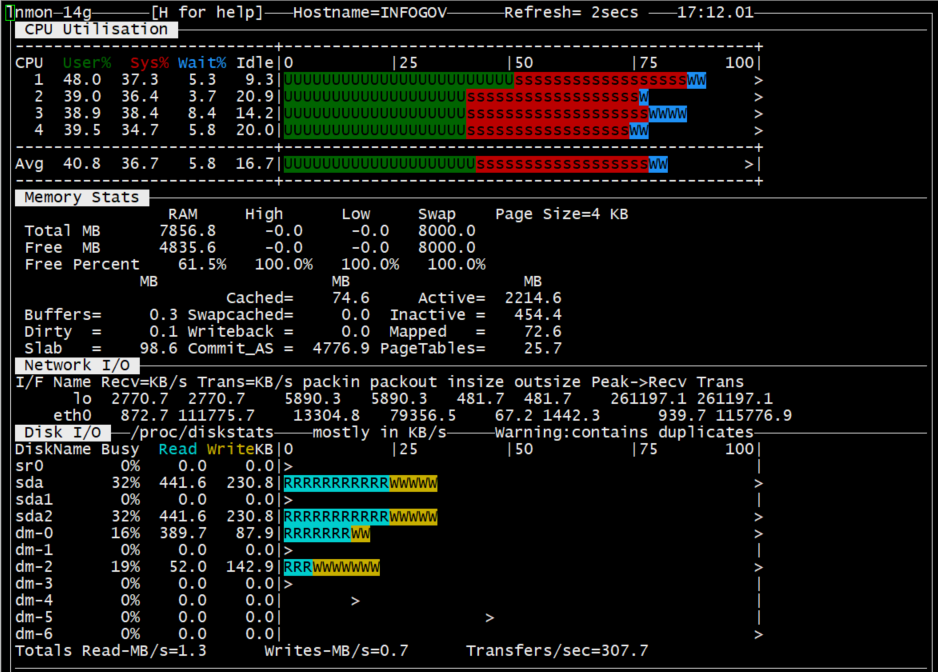
8线程时: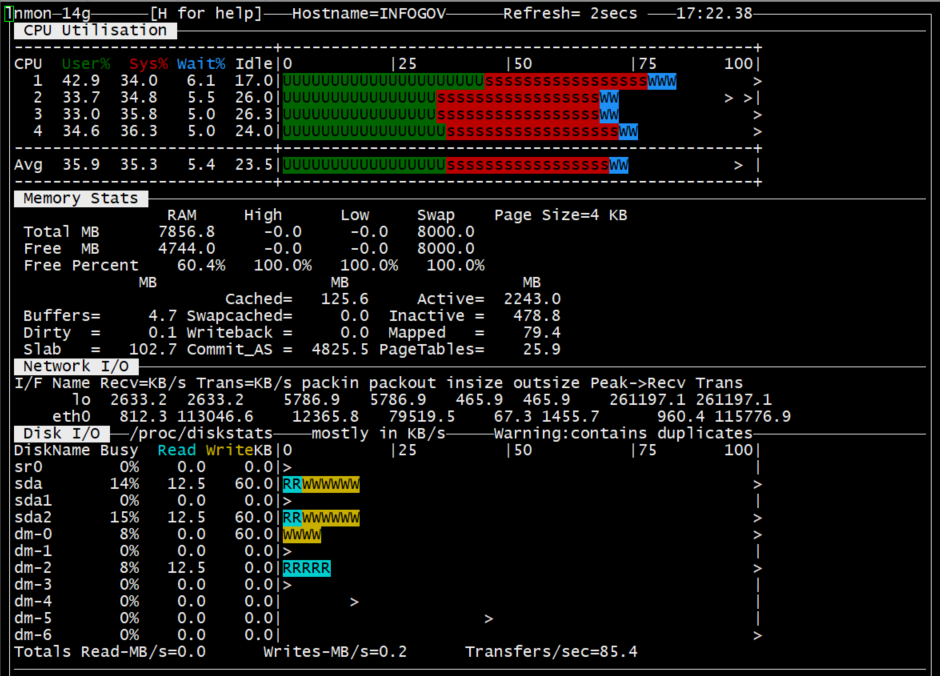
测试结果: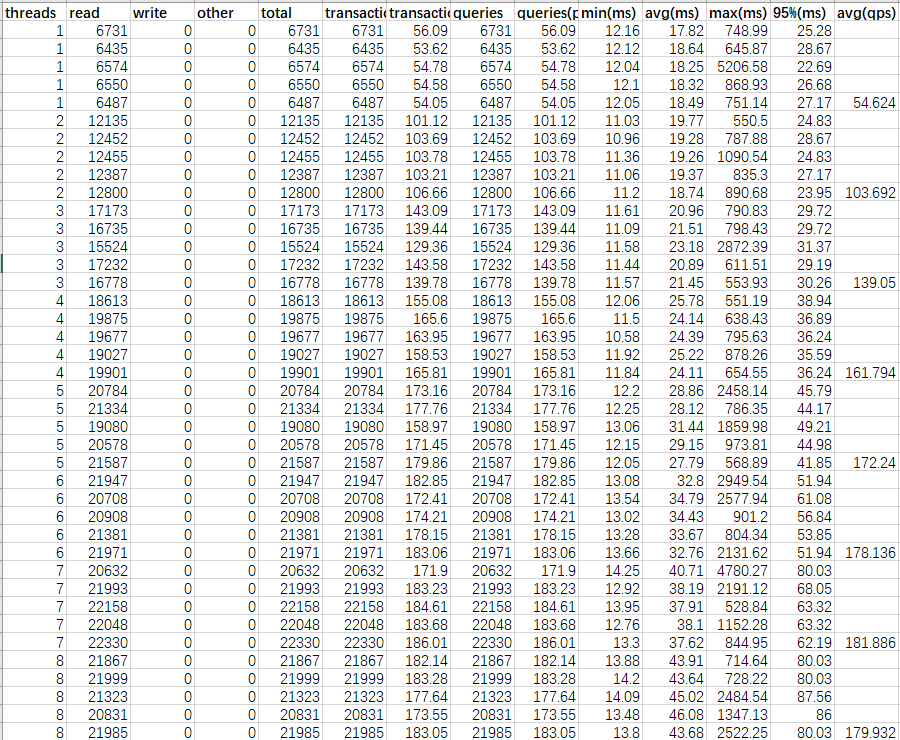
场景2:查询某个station的某个type的某一天所有的记录
1 | #!/usr/bin/env sysbench |
测试时服务器的情况:
1线程时: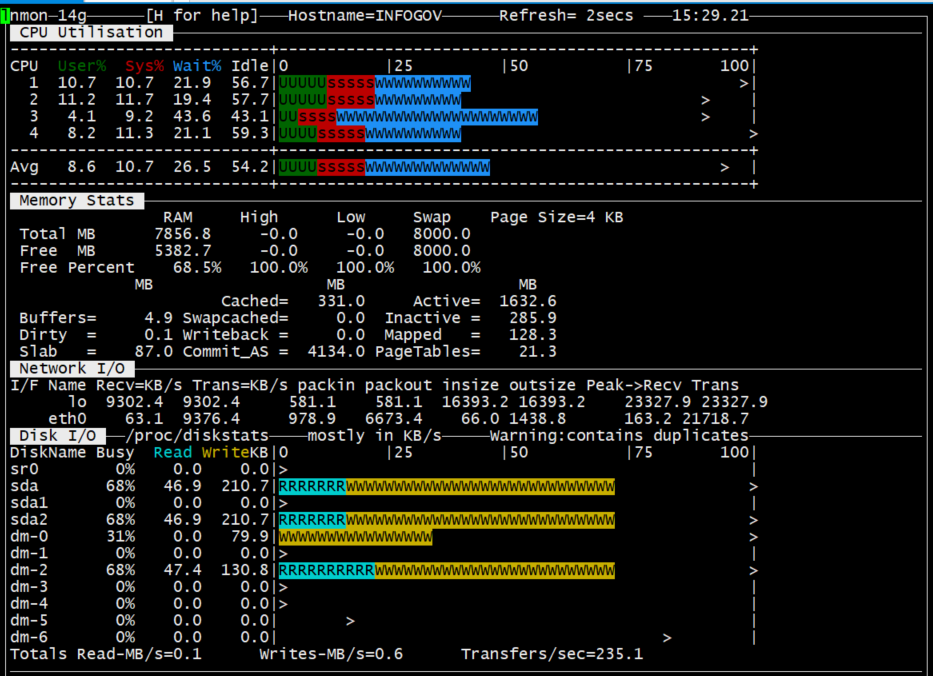
2线程时:
3线程时:(忘截图了)
4线程时:
5线程时: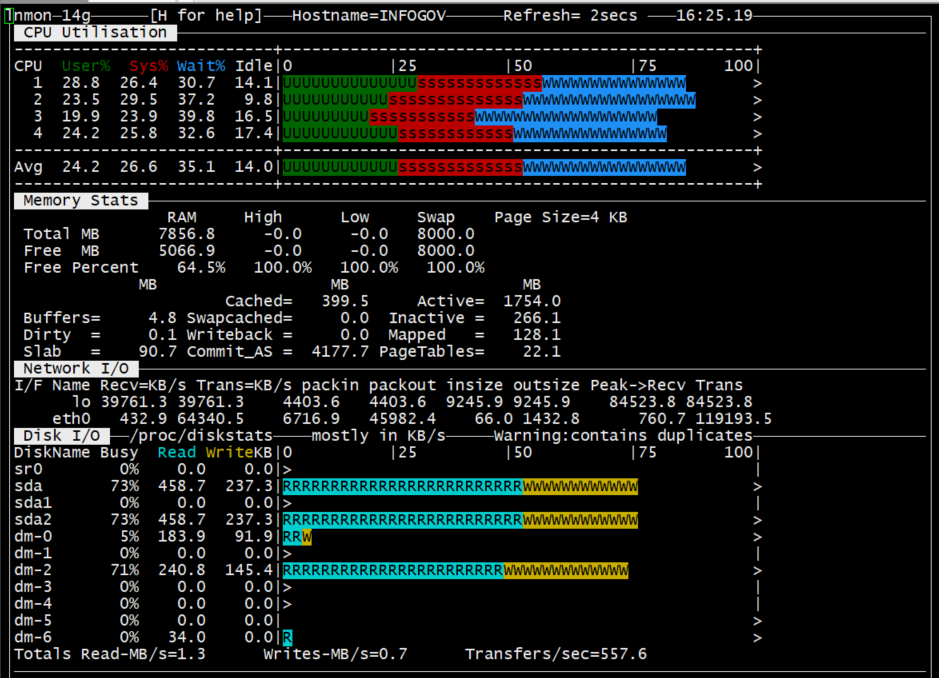
6线程时: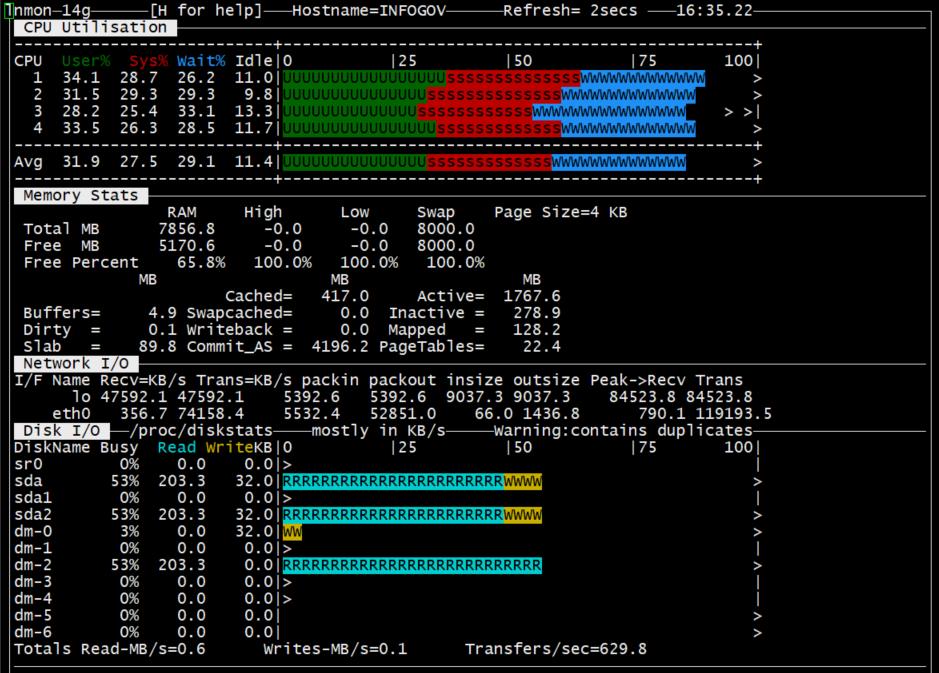
7线程时: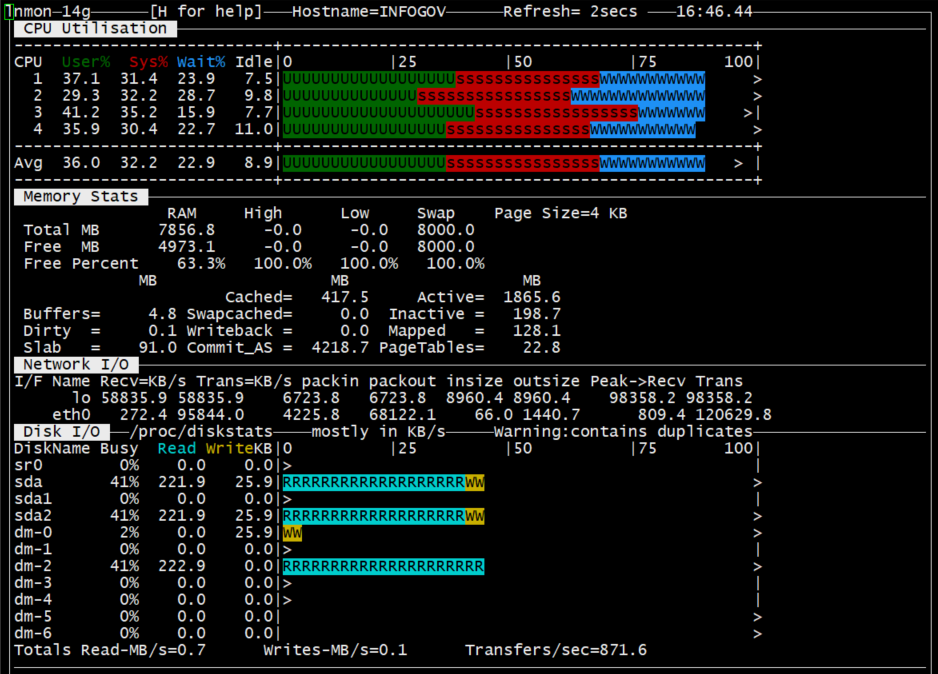
8线程时: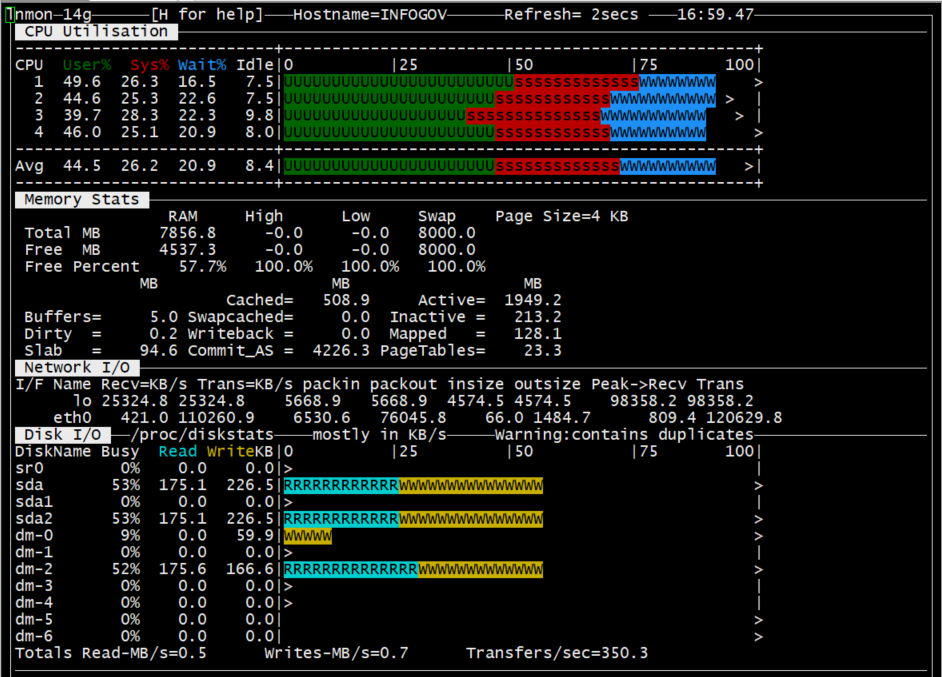
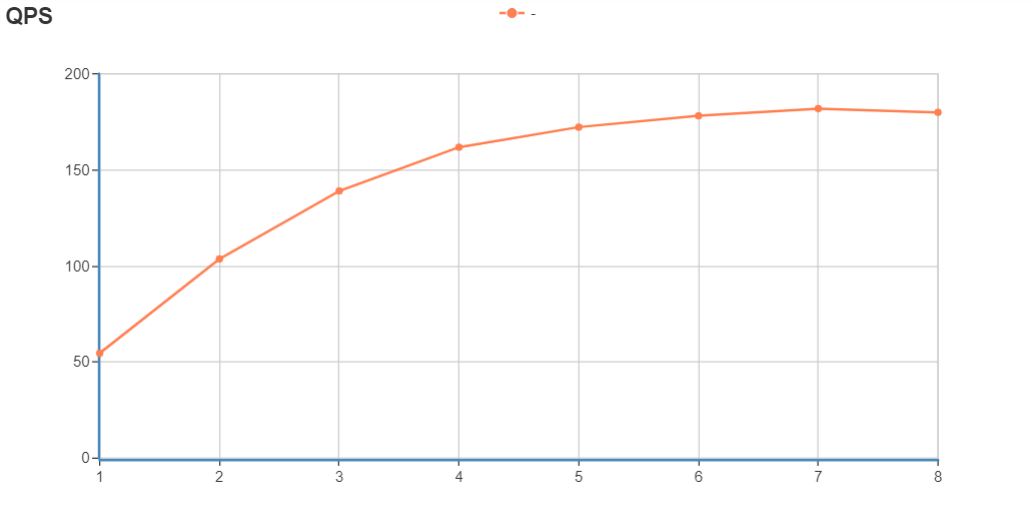
测试结果: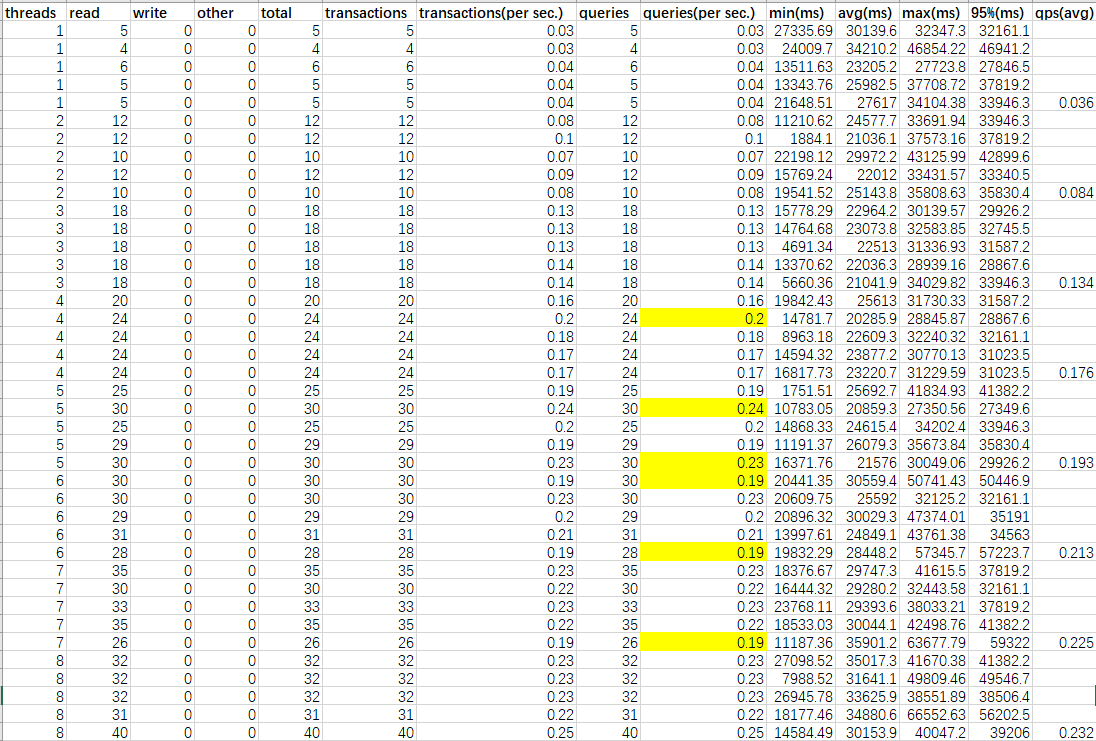
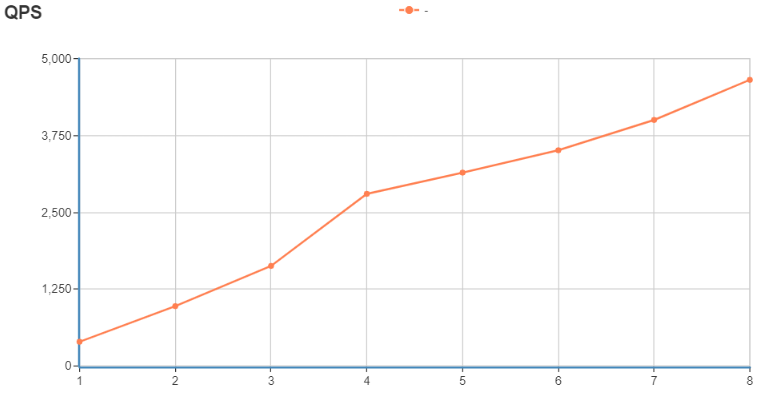
总结
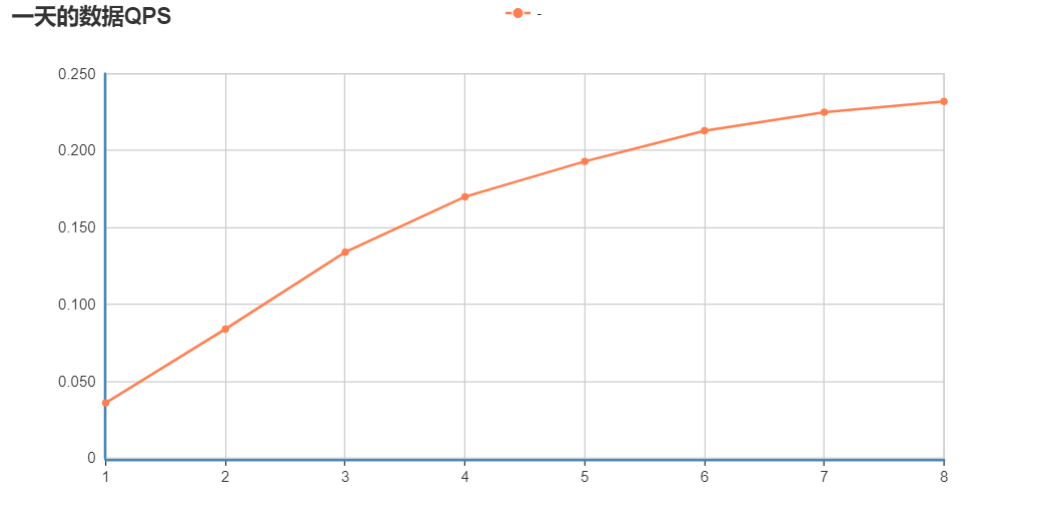
目前实现的FDW的随线程数增多,QPS也增大,在7和8个线程时,基本不再增长,此时基本达到网卡的上限100MB+/s。
注:由于测试环境中,同一个station同一个type的同一时间里是有3条数据返回的,但实际的环境应该是只有一条的,因此两个场景查询得到的数据量是实际的3倍,如果在实际环境上QPS应该还是有差异的(提升?)。
反思
由于一开始对测试的需求不太理解,以自己的想法去弄,导致测试结果完全是错误的。还有就是对于不熟悉的工具,还是需要花一点时间去熟悉,不然只会走更多的弯路。